Manual:The Dude v6/Charts: Difference between revisions
No edit summary |
No edit summary |
||
| (One intermediate revision by the same user not shown) | |||
| Line 18: | Line 18: | ||
[[File:Dude-charts-2.JPG|800px]] | [[File:Dude-charts-2.JPG|800px]] | ||
== Function code example == | |||
Use '''ros_command''' function, to execute command in RouterOS, get output value, and create a chart from these values. | |||
First click Charts -> Data Sources -> [+] to create a new one | |||
Add name, choose device from where data will be collected, and enter code. | |||
Code to check wireless transmit speed: | |||
<pre> ros_command(":put ((([/interface monitor-traffic wlan1 once as-value]->\"tx-bits-per-second\")/1000)/100);") </pre> | |||
Code to check nummber of connected devices to wlan1 interface: | |||
<pre> ros_command("/interface wireless registration-table print count-only where interface=wlan1") </pre> | |||
It's possible to get any value you need, simply modify '''ros_command()''' code. | |||
== SNMP example == | |||
To use SNMP as data source, create new data source, specify device, add OID: | |||
<pre> oid("1.3.6.1.4.1.14988.1.1.3.10.0") </pre> | |||
Or use snmpwalk, select OID you want to monitore -> right click -> create data source. The code should look like this: | |||
<pre> oid_raw("1.3.6.1.4.1.14988.1.1.3.10.0", 5, 5, "172.16.4.21", "v2-public") </pre> | |||
[[Category:Dude]] | [[Category:Dude]] | ||
Latest revision as of 18:32, 8 February 2017
Adding new charts
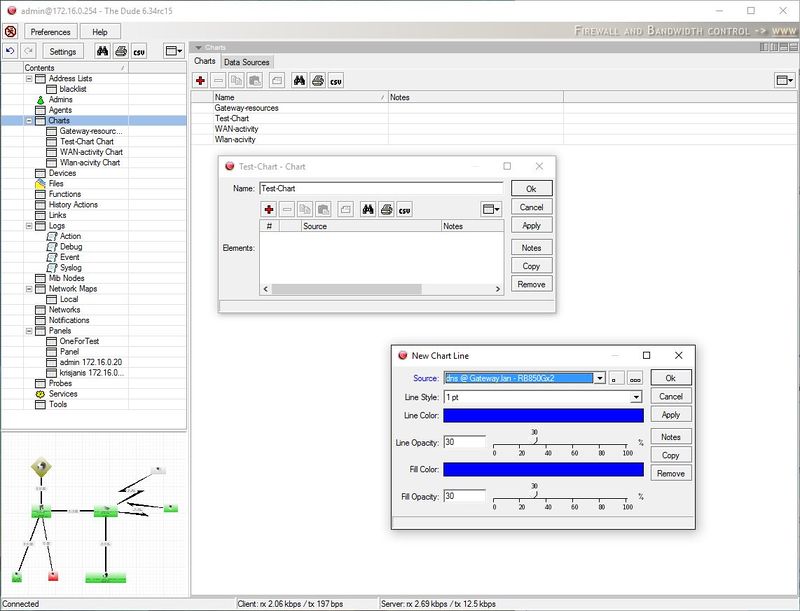
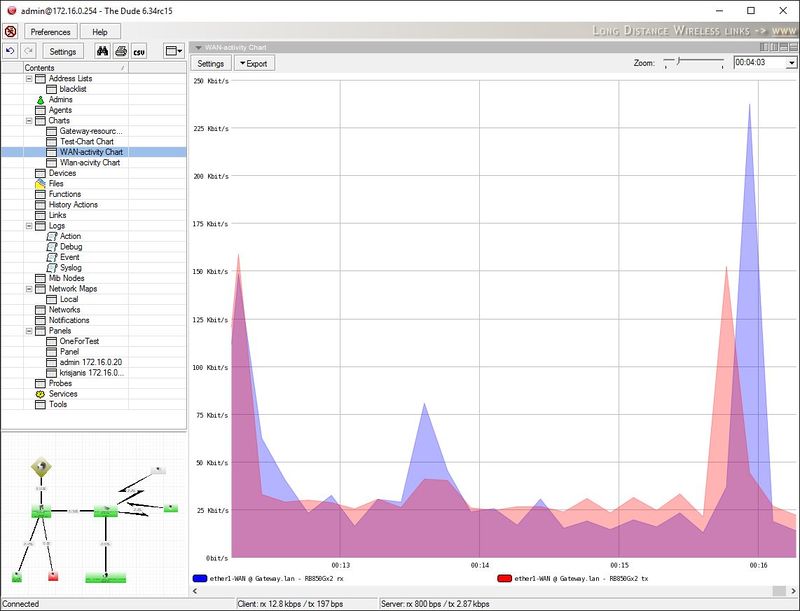
The Charts pane allows you to set up visual area charts to represent any data that is available to The Dude. Click on the Add button to make a new chart.
The Dude will automatically offer existing data sources that are known from the Devices you have created. Simply choose one or more data sources for your new chart, and click OK to finalize the setup. All created charts will be listed in the Charts pane. You can open any chart for viewing from the lefthand menu or from the list in the Charts pane.
Data sources
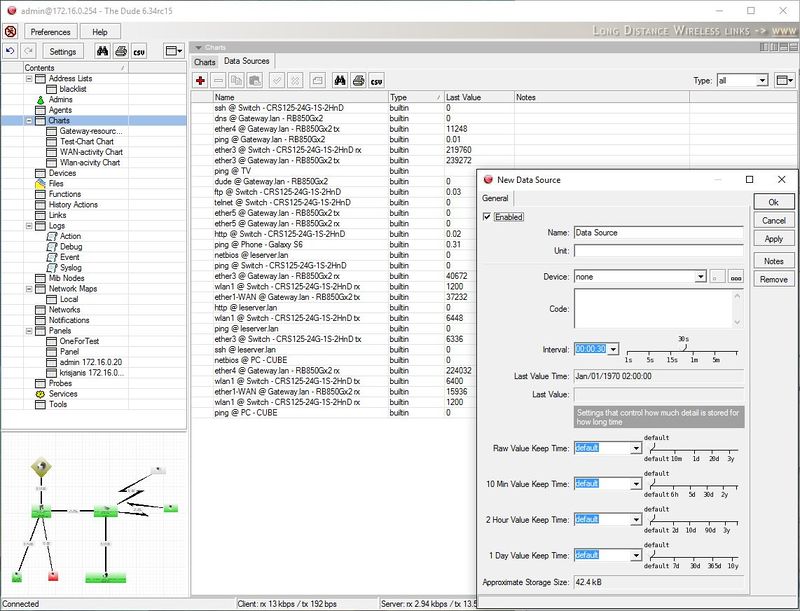
In the Data sources tab you can add new sources of Data that have not been previously known from the added device polling mechanisms. You can also specify the amount of time that specific data ranges will be kept in the Dude database. The Dude will show approximate amount of space they will take up.
When adding a new Data Source, you will be asked for Code, which is a scripting language of the same kind that is used in the Dude Functions. See examples in the Functions section.
Function code example
Use ros_command function, to execute command in RouterOS, get output value, and create a chart from these values.
First click Charts -> Data Sources -> [+] to create a new one
Add name, choose device from where data will be collected, and enter code.
Code to check wireless transmit speed:
ros_command(":put ((([/interface monitor-traffic wlan1 once as-value]->\"tx-bits-per-second\")/1000)/100);")
Code to check nummber of connected devices to wlan1 interface:
ros_command("/interface wireless registration-table print count-only where interface=wlan1")
It's possible to get any value you need, simply modify ros_command() code.
SNMP example
To use SNMP as data source, create new data source, specify device, add OID:
oid("1.3.6.1.4.1.14988.1.1.3.10.0")
Or use snmpwalk, select OID you want to monitore -> right click -> create data source. The code should look like this:
oid_raw("1.3.6.1.4.1.14988.1.1.3.10.0", 5, 5, "172.16.4.21", "v2-public") 


