Manual:Tools/Graphing: Difference between revisions
| Line 123: | Line 123: | ||
|type=yes {{!}} no | |type=yes {{!}} no | ||
|default=yes | |default=yes | ||
|desc= | |desc=Whether to allow access to graphs from queue's target-address | ||
}} | }} | ||
| Line 153: | Line 153: | ||
|desc=Defines whether to store collected information on system drive. | |desc=Defines whether to store collected information on system drive. | ||
}} | }} | ||
==Resource graphing== | ==Resource graphing== | ||
Revision as of 10:59, 10 June 2011
Summary
Graphing is a tool to monitor various RouterOS parameters over time and put collected data in nice graphs.
The Graphing tool can display graphics for:
- Routerboard health (voltage and temperature)
- Resource usage (CPU, Memory and Disk usage)
- Traffic which is passed through interfaces
- Traffic which is passed through simple queues
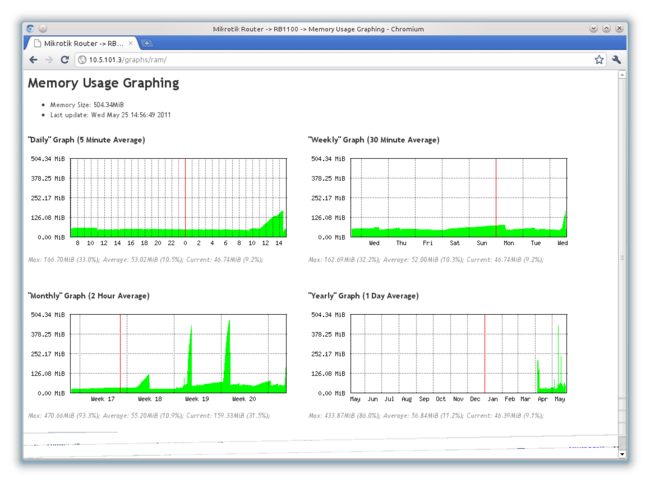
Graphing consists of two parts - first part collects information and other part displays data in a Web page. To access the graphics, type http://[Router_IP_address]/graphs/ and choose a graphic to display in your Web browser.
General
Sub-menu /tool graphing
Common graphing configuration can be set in this submenu.
Properties
| Property | Description |
|---|---|
| store-every (24hours | 5min | hour; Default: 5min) | How often to write collected data to system drive. |
| page-refresh (integer | never; Default: 300) | How often graph page is refreshed |
Interface graphing
Sub-menu /tool graphing interface
Sub-menu allows to configure on which interfaces graphing will collect bandwidth usage data.
Properties
| Property | Description |
|---|---|
| allow-address (IP/IPv6 prefix; Default: 0.0.0.0/0) | IP address range from which is allowed to access graphing information |
| comment (string; Default: ) | Description of current entry |
| disabled (yes | no; Default: no) | Defines whether item is used |
| interface (all | interface name; Default: all) | Defines which interface will be monitored. all means that all interfaces on router will be monitored. |
| store-on-disk (yes | no; Default: yes) | Defines whether to store collected information on system drive. |
Queue graphing
Sub-menu /tool graphing queue
Sub-menu allows to configure about which simple queues graphing will collect bandwidth usage data.
Properties
| Property | Description |
|---|---|
| allow-address (IP/IPv6 prefix; Default: 0.0.0.0/0) | IP address range from which is allowed to access graphing information |
| allow-target (yes | no; Default: yes) | Whether to allow access to graphs from queue's target-address |
| comment (string; Default: ) | Description of current entry |
| disabled (yes | no; Default: no) | Defines whether item is used |
| simple-queue (all | queue name; Default: all) | Defines which queues will be monitored. all means that all queues on router will be monitored. |
| store-on-disk (yes | no; Default: yes) | Defines whether to store collected information on system drive. |
Resource graphing
Sub-menu /tool graphing resource
Sub-menu allows to enable graphing of system resources. Graphing collects data of:
- CPU usage
- Memory usage
- Disk usage
Properties
| Property | Description |
|---|---|
| allow-address (IP/IPv6 prefix; Default: 0.0.0.0/0) | IP address range from which is allowed to access graphing information |
| comment (string; Default: ) | Description of current entry |
| disabled (yes | no; Default: no) | Defines whether item is used |
| store-on-disk (yes | no; Default: yes) | Defines whether to store collected information on system drive. |
Graphing graphics in WinBox
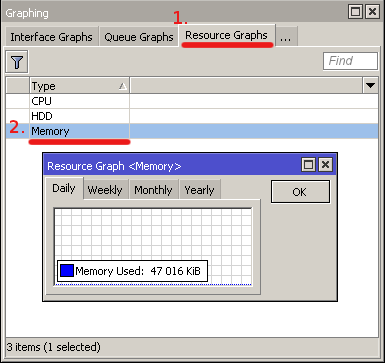
Winbox allows to view the same collected information as in web page. Open Tools->Graphing window. Double click on entry of which you want to see graphs.
Image below shows winbox graphs of memory usage:

[ Top | Back to Content ]

