Manual:The Dude/Charts
Jump to navigation
Jump to search
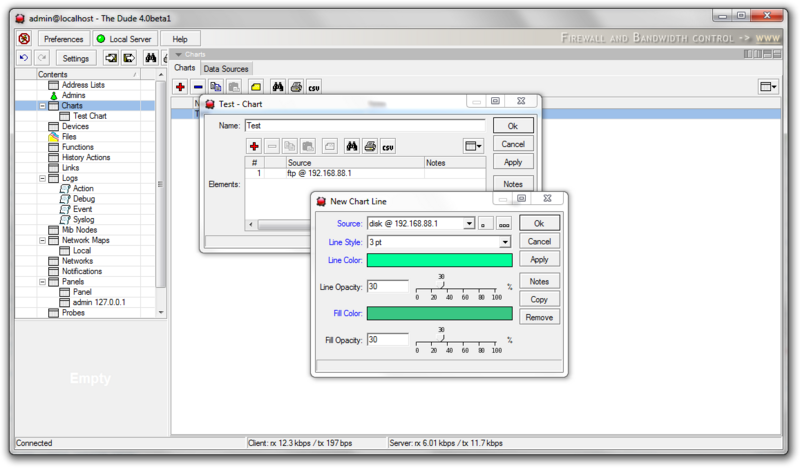
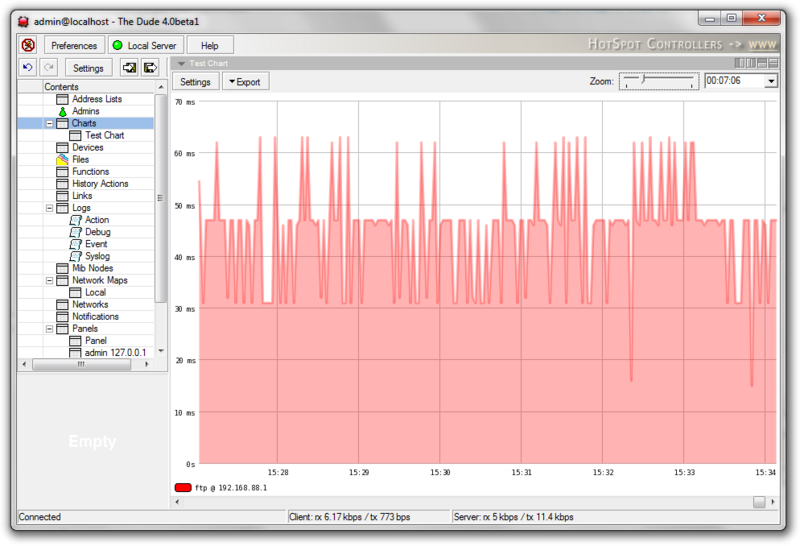
The Charts pane allows you to set up visual area charts to represent any data that is available to The Dude. Click on the Add button to make a new chart.
The Dude will automatically offer existing data sources that are known from the Devices you have created. Simply choose one or more data sources for your new chart, and click OK to finalize the setup. All created charts will be listed in the Charts pane. You can open any chart for viewing from the lefthand menu or from the list in the Charts pane.

