Manual:Tools/Profiler: Difference between revisions
Jump to navigation
Jump to search

(Created page with '{{Versions| v5beta7 +}} __TOC__ <div class=manual> ==Summary== <p id="shbox"><b>Command:</b> <code>/tool profile</code> <br /> <b>Standards:</b> <code></code></p> <br /> <p> …') |
|||
| (3 intermediate revisions by one other user not shown) | |||
| Line 33: | Line 33: | ||
unclassified 0.5% | unclassified 0.5% | ||
</pre> | |||
===CPU usage on multi-core systems=== | |||
On multi-core systems tool allows to specify per core CPU usage. | |||
For example, to view CPU usage on second core use following command: | |||
<pre> | |||
[admin@x86-test] > /tool profile cpu=2 | |||
NAME CPU USAGE | |||
ethernet 1 0% | |||
kvm 1 2.5% | |||
management 1 0.5% | |||
idle 1 96.5% | |||
profiling 1 0% | |||
unclassified 1 0.5% | |||
</pre> | |||
<code>"cpu"</code> parameter allows to specify integer number which represents a core or two of predefined values '''all''' and '''total''' | |||
* total - this value sets to show sum of all core usages; | |||
* all - value sets to show cpu usages separately for every available core | |||
Example with both values on two core system: | |||
<pre> | |||
[admin@x86-test] > /tool profile cpu=all | |||
NAME CPU USAGE | |||
ethernet 1 0% | |||
kvm 0 0% | |||
kvm 1 4.5% | |||
management 0 0% | |||
management 1 0.5% | |||
idle 0 100% | |||
idle 1 93% | |||
profiling 0 0% | |||
profiling 1 2% | |||
[admin@x86-test] > /tool profile cpu=total | |||
NAME CPU USAGE | |||
ethernet all 0% | |||
console all 0% | |||
kvm all 2.7% | |||
management all 0% | |||
idle all 97.2% | |||
profiling all 0% | |||
bridging all 0% | |||
</pre> | </pre> | ||
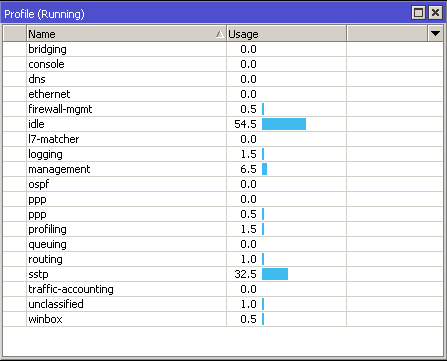
Tool is also available in winbox: | Tool is also available in winbox: | ||
<center>[[File:profiler.png]]</center> | <center>[[File:profiler.png]]</center> | ||
==Classifiers== | |||
Profile classifies processes in several classifiers. Most of them are self explanatory and does not require detailed explanation. | |||
* '''idle''' - shows unused CPU. Typically idle=100%-(sum of all process cpu usages). | |||
* '''ppp''' | |||
* '''pppoe''' | |||
* '''ppp-compression''' | |||
* '''ppp-mppe''' | |||
* '''ethernet''' - cpu used by ethernets when sending/receiving packets | |||
* '''bridging''' | |||
* '''encrypting''' - cpu used by packet encryption | |||
* '''ipsec''' - [[M:IP/IPsec | IP security]] | |||
* '''queuing''' - packet queuing | |||
* '''firewall''' - packet processing in [[M:IP/Firewall | Ip firewall]] | |||
* '''l7-matcher''' - cpu used by [[M:IP/Firewall/L7 | Layer7 matcher]]. | |||
* '''p2p-matcher''' - Peer-to-peer traffic matcher in ip firewall | |||
* '''gre''' - Gre tunnels | |||
* '''eoip''' - [[M:Interface/EoIP | EoIP tunnels]] | |||
* '''m3p''' - MikroTik Packet Packer Protocol | |||
* '''radius''' | |||
* '''ip-pool''' | |||
* '''routing''' | |||
* '''sniffing''' | |||
* '''traffic-accounting''' | |||
* '''traffic-flow''' | |||
* '''console''' | |||
* '''telnet''' | |||
* '''ssh''' | |||
* '''ftp''' | |||
* '''tfpt''' | |||
* '''www''' | |||
* '''dns''' | |||
* '''snmp''' | |||
* '''socks''' | |||
* '''web-proxy''' | |||
* '''winbox''' | |||
* '''metarouter-fs''' | |||
* '''metarouter-net''' | |||
* '''kvm''' | |||
* '''profiling''' - cpu used by Profiler tool itself | |||
* '''btest''' - bandwidth test tool | |||
* '''logging''' | |||
* '''flash''' - cpu usage when writing to NAND | |||
* '''disk''' - cpu usage when wiring to Disk | |||
* '''networking''' - core packet processing | |||
* '''serial''' | |||
* '''usb''' | |||
* '''firewall-mgmt''' | |||
* '''queue-mgmt''' | |||
* '''e-mail''' | |||
* '''fetcher''' | |||
* '''backup''' | |||
* '''graphing''' | |||
* '''health''' | |||
* '''isdn''' | |||
* '''dhcp''' | |||
* '''hotspot''' | |||
* '''radv''' - IPv6 route advertisement | |||
* '''ntp''' - [[Manual:System/Time#SNTP_client | NTP]] server/client | |||
* '''ldp''' | |||
* '''mpls''' | |||
* '''pim''' - Multicast routing protocol | |||
* '''igmp-proxy''' | |||
* '''bgp''' | |||
* '''ospf''' | |||
* '''rip''' | |||
* '''mme''' | |||
* '''synchronous''' - cpu usage by synchronous cards | |||
* '''gps''' | |||
* '''user-manager''' | |||
* '''wireless''' | |||
* '''dude''' | |||
* '''supout.rif''' - cpu used by supout.rif file creator. | |||
* '''management''' - RouterOS management processes that do not fall into any other classifier. For example, when routes added to kernel, internal messaging exchange between RouterOS applications, etc. | |||
* '''unclassified''' - any other processes that were not classified. | |||
{{cont}} | {{cont}} | ||
Latest revision as of 07:19, 11 September 2015
Applies to RouterOS: v5beta7 +
Summary
Command: /tool profile
Standards:
Profiler tool shows CPU usage for each process running in RouterOS. It helps to identify which process is using most of the CPU resources.
[admin@dzeltenais_burkaans] > /tool profile
NAME             USAGE
sstp             9%
ppp              0.5%
ethernet         0%
queue-mgmt       0%
console          0.5%
dns              0%
winbox           0%
logging          0%
management       1.5%
ospf             0%
idle             87.5%
profiling        0.5%
queuing          0%
routing          0%
bridging         0%
unclassified     0.5%
CPU usage on multi-core systems
On multi-core systems tool allows to specify per core CPU usage. For example, to view CPU usage on second core use following command:
[admin@x86-test] > /tool profile cpu=2
NAME             CPU        USAGE
ethernet         1          0%
kvm              1          2.5%
management       1          0.5%
idle             1          96.5%
profiling        1          0%
unclassified     1          0.5%
"cpu" parameter allows to specify integer number which represents a core or two of predefined values all and total
- total - this value sets to show sum of all core usages;
- all - value sets to show cpu usages separately for every available core
Example with both values on two core system:
[admin@x86-test] > /tool profile cpu=all
NAME             CPU        USAGE
ethernet         1          0%
kvm              0          0%
kvm              1          4.5%
management       0          0%
management       1          0.5%
idle             0          100%
idle             1          93%
profiling        0          0%
profiling        1          2%

[admin@x86-test] > /tool profile cpu=total
NAME             CPU        USAGE
ethernet         all        0%
console          all        0%
kvm              all        2.7%
management       all        0%
idle             all        97.2%
profiling        all        0%
bridging         all        0%
Tool is also available in winbox:

Classifiers
Profile classifies processes in several classifiers. Most of them are self explanatory and does not require detailed explanation.
- idle - shows unused CPU. Typically idle=100%-(sum of all process cpu usages).
- ppp
- pppoe
- ppp-compression
- ppp-mppe
- ethernet - cpu used by ethernets when sending/receiving packets
- bridging
- encrypting - cpu used by packet encryption
- ipsec - IP security
- queuing - packet queuing
- firewall - packet processing in Ip firewall
- l7-matcher - cpu used by Layer7 matcher.
- p2p-matcher - Peer-to-peer traffic matcher in ip firewall
- gre - Gre tunnels
- eoip - EoIP tunnels
- m3p - MikroTik Packet Packer Protocol
- radius
- ip-pool
- routing
- sniffing
- traffic-accounting
- traffic-flow
- console
- telnet
- ssh
- ftp
- tfpt
- www
- dns
- snmp
- socks
- web-proxy
- winbox
- metarouter-fs
- metarouter-net
- kvm
- profiling - cpu used by Profiler tool itself
- btest - bandwidth test tool
- logging
- flash - cpu usage when writing to NAND
- disk - cpu usage when wiring to Disk
- networking - core packet processing
- serial
- usb
- firewall-mgmt
- queue-mgmt
- fetcher
- backup
- graphing
- health
- isdn
- dhcp
- hotspot
- radv - IPv6 route advertisement
- ntp - NTP server/client
- ldp
- mpls
- pim - Multicast routing protocol
- igmp-proxy
- bgp
- ospf
- rip
- mme
- synchronous - cpu usage by synchronous cards
- gps
- user-manager
- wireless
- dude
- supout.rif - cpu used by supout.rif file creator.
- management - RouterOS management processes that do not fall into any other classifier. For example, when routes added to kernel, internal messaging exchange between RouterOS applications, etc.
- unclassified - any other processes that were not classified.
[ Top | Back to Content ]